Introduction: When Guessing Isn’t Enough Anymore
In the early days of running a retail store, it’s common to rely on instinct. You look at the cash drawer. You feel the vibe. You guess if things are going well. But as your business grows, guessing becomes dangerous.
You start buying more stock than you need. Or you run out of your best-selling item. Or you spend on ads… but can’t tell if they’re working. You feel busy — but not necessarily better off.
That’s when many store owners hit a wall.
Because what you don’t measure, you can’t improve.
And what you do measure — if it’s the wrong thing — can mislead you.
It’s not about tracking everything. It’s about tracking what matters.
Smart growth doesn’t come from working harder. It comes from understanding what’s working — and doing more of it. That means identifying the few key metrics that give you clarity, not confusion.
This article will walk you through the five most important metrics every retail business should track if they want to grow with confidence and profitability. We’ll break down what each one means, why it matters, how to calculate it (simply), and how to use it to make better decisions.
Whether you’re running a beauty shop, a bookstore, a pet store or a mini-market — these metrics apply. And they can help you move from guesswork… to growth.
Let’s start with the one metric most store owners check — but rarely use to its full potential.
1. Sales Revenue: The Starting Point (Not the End Goal)
Sales revenue is the total amount of money your store brings in from sales. It’s often the first number store owners look at — and that’s good. But it’s only the beginning.
Why it matters:
Your sales show your ability to attract and convert customers. They reveal seasonal trends, product popularity, and marketing effectiveness.
What it doesn’t tell you:
Revenue alone doesn’t mean profit. You can sell a lot and still lose money if costs are too high. That’s why revenue must be paired with other metrics (like margins and expenses).
How to calculate it:
Total Sales Revenue = Total number of items sold × Price of each item
(Or simply total amount charged at the register over a period)
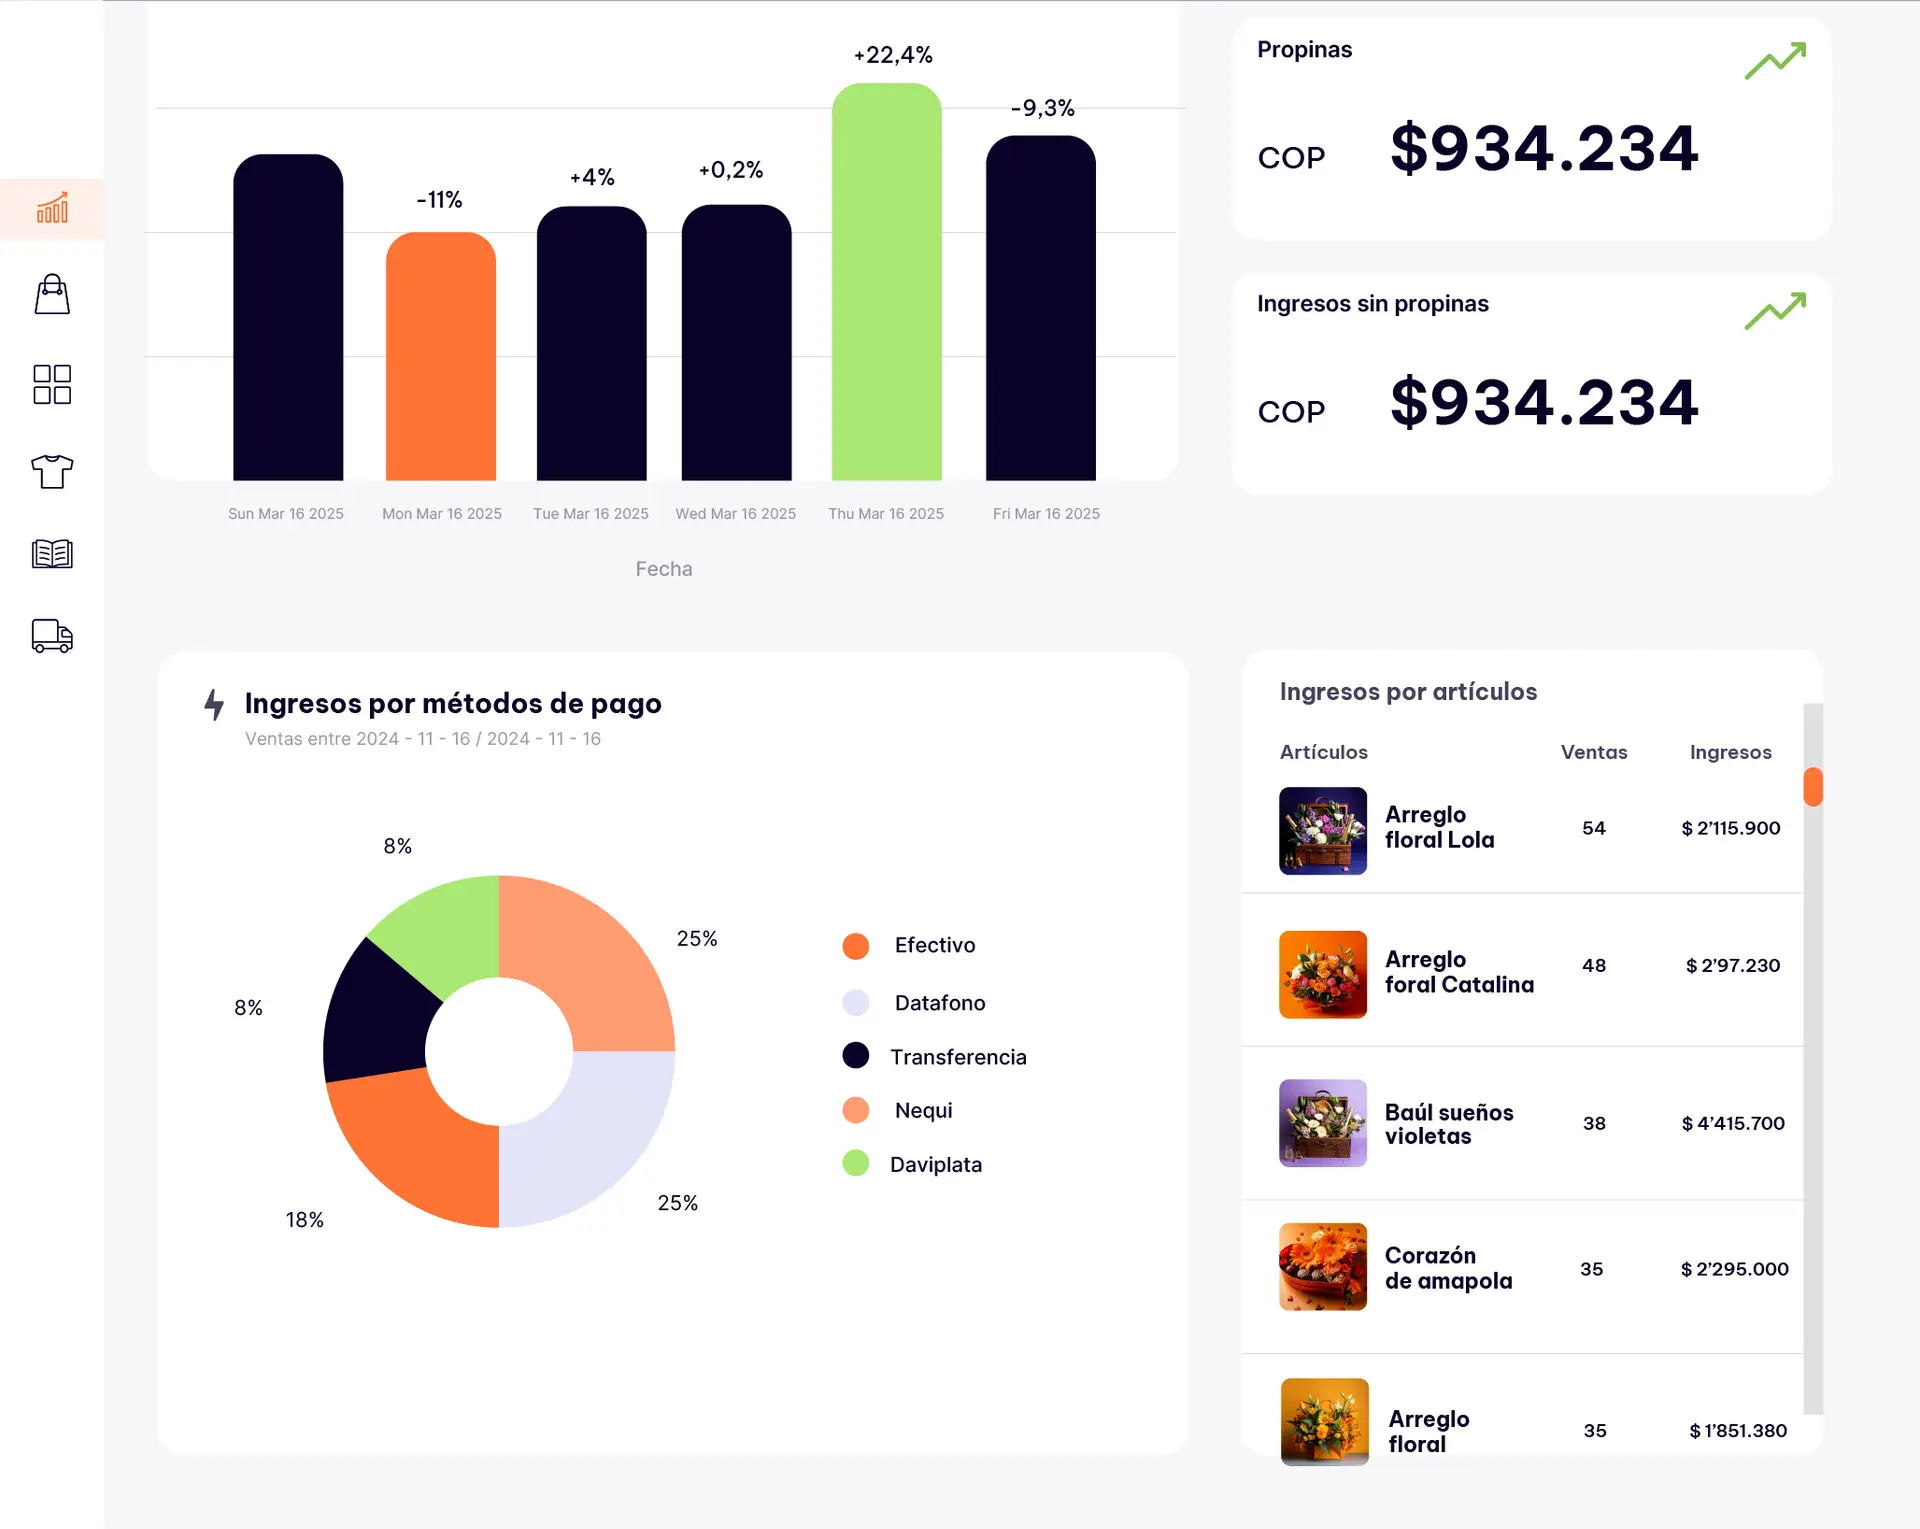
What to track specifically:
- Daily/weekly/monthly sales
- Sales per product category
- Sales by channel (in-store, online, WhatsApp, etc.)
- Sales by time of day or day of week
Example:
Paula owns a beauty shop. She tracks monthly revenue and sees that March sales were higher than February — but only after breaking it down does she realize 80% of those sales came from one promotion that hurt her margins. Lesson learned: revenue ≠ sustainable growth.
Practical Exercise:
Take your total revenue from last month and break it down:
- Top 3 selling products
- Top 2 sales days
- % of revenue from each sales channel
What trends do you notice? What’s working — and what isn’t?
2. Gross Margin: How Much You Really Keep
You don’t just want to sell. You want to make money from every sale. That’s where gross margin comes in — one of the most overlooked but crucial retail metrics.
Why it matters:
Gross margin tells you how much profit you’re making on your products before expenses. A healthy margin allows you to reinvest, hire, run promotions, or survive tough months.
How to calculate it:
Gross Margin (%) =
((Sales Revenue – Cost of Goods Sold) ÷ Sales Revenue) × 100
What’s a good margin?
It depends on your industry, but many small retailers aim for 30–50%. Low-margin businesses can survive — if they have volume and cost control.
What to track specifically:
- Margin per product (especially bestsellers)
- Margin per category (beauty, food, accessories, etc.)
- Margin by supplier (some cost more than others)
Example:
Miguel runs a convenience store. He notices that snacks have a margin of 35%, but sodas only 15%. He renegotiates with his distributor and shifts his shelf space to higher-margin items. In two months, profits go up 12% — even though sales stay the same.
Practical Exercise:
Choose 5 of your top-selling products. For each:
- How much do you sell it for?
- How much did it cost you (unit cost)?
Calculate the margin. Which items are profitable — and which ones are just taking up space?
3. Conversion Rate: Turning Visitors Into Buyers
Your store may be full of people… but are they buying? That’s what conversion rate helps you understand.
Why it matters:
It shows how well you’re turning interest into income. A low conversion rate means missed opportunities — especially if you’re investing in traffic (ads, influencers, flyers, etc.).
How to calculate it:
Conversion Rate (%) =
(Number of sales ÷ Number of visitors) × 100
Online example:
100 website visits → 8 purchases = 8% conversion
In-store example:
50 walk-ins on Monday → 10 purchases = 20% conversion
What to track specifically:
- Conversion by time or day
- Conversion by channel (Instagram, WhatsApp, foot traffic)
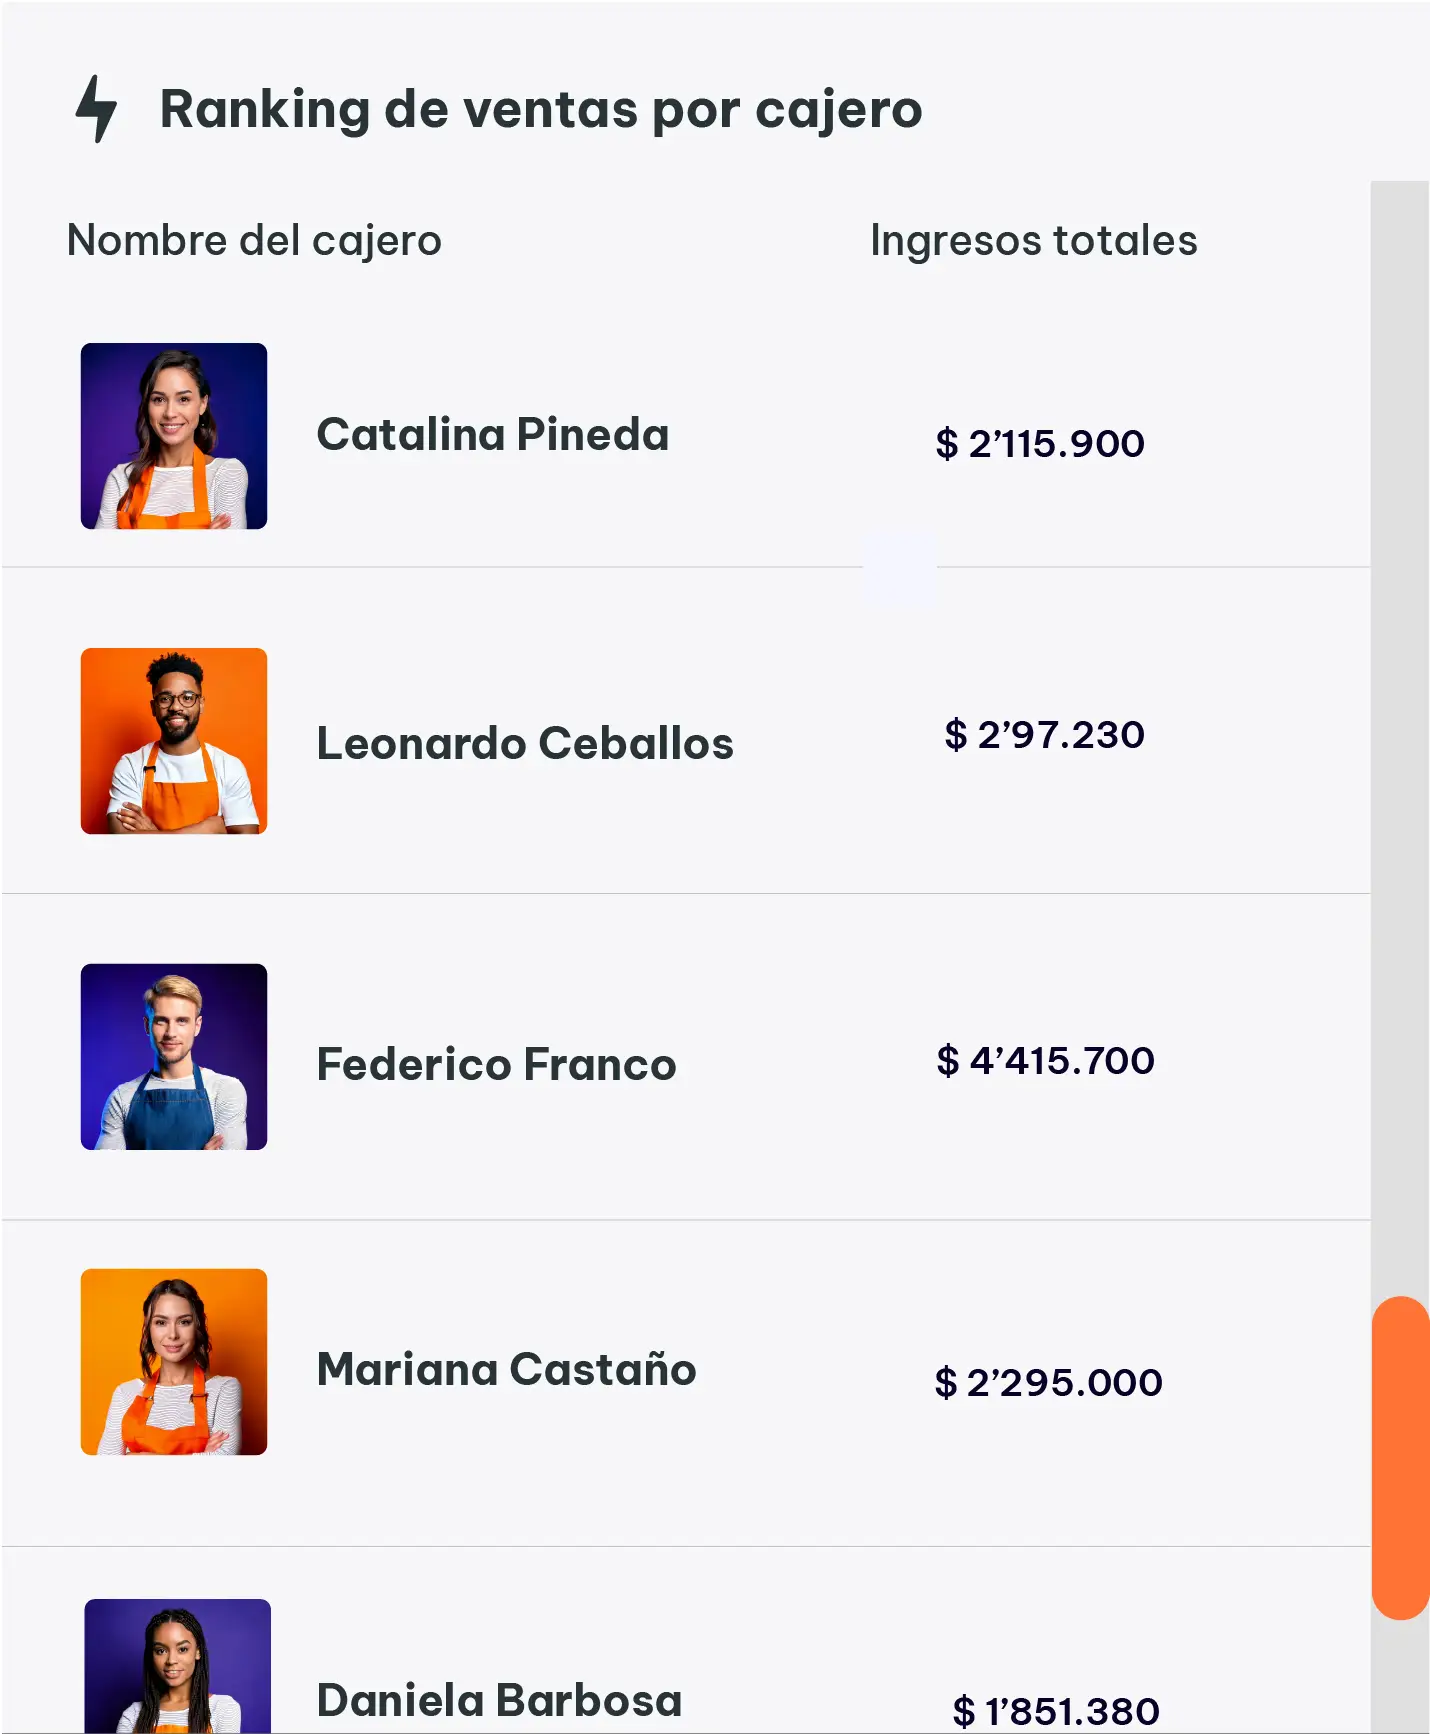
- Conversion by staff member (if tracked by POS)
Example:
Laura owns a fashion boutique. She notices that foot traffic is high on Saturdays, but sales are lower than Fridays. After observing, she realizes her Saturday staff aren’t trained to upsell. She holds a quick training and sees conversion jump from 12% to 19% the next weekend.
Practical Exercise:
Choose a 3-day window this week. Count:
- How many people enter your store (or DM you)
- How many actually buy
Calculate the conversion rate. What could you do to improve it by 5%?
4. Customer Retention Rate: The Growth You Don’t See
Attracting new customers is exciting. But the real power in retail lies in keeping the ones you already have. That’s what Customer Retention Rate (CRR) measures.
Why it matters:
It’s far cheaper to retain a customer than to acquire a new one. Loyal customers spend more, buy more often, and refer others. If you’re only focused on acquisition, you’re leaving money on the table.
How to calculate it (basic version):
Customer Retention Rate (%) =
((Customers at end of period – New customers during period) ÷ Customers at start of period) × 100
Simplified version for small retailers:
Out of 10 people who bought from you last month, how many came back this month?
What to track specifically:
- Repeat customers per month
- Repeat rate by product type or service
- Impact of loyalty programs on return visits
Example:
Andrea runs a small bookstore. She starts offering a simple loyalty punch card: buy 5 books, get 1 free. Within 3 months, her repeat customer rate goes from 18% to 32% — and those loyal buyers start bringing friends.
Practical Exercise:
Pick 10 customers who bought from you last month. How many returned this month? What could you do to bring 2 more back? Consider a follow-up message, small incentive, or simply a “thank you” that feels personal.
5. Average Order Value (AOV): Make Every Sale Worth More
Not every customer will come back often — so it’s smart to increase the value of each purchase when they do. That’s where Average Order Value comes in.
Why it matters:
If 100 people buy, you can earn $1,000 or $3,000 — depending on what and how much they buy. AOV helps you grow revenue without needing more customers.
How to calculate it:
Average Order Value =
Total revenue ÷ Number of transactions
What to track specifically:
- AOV by product category
- AOV by promotion or campaign
- AOV by sales channel
Tactics to increase AOV:
- Product bundles or kits
- Upselling (premium version)
- Cross-selling (complementary items)
- Minimum order incentives (“Buy $50+ and get free delivery”)
Example:
Daniel owns a pet supply shop. His average order is $15. After creating “new puppy kits” that bundle food, a toy, and shampoo for $35, his AOV rises to $23 in just a month — without increasing foot traffic.
Practical Exercise:
Look at the last 10 orders. What was the average spend? What’s one bundle, add-on, or incentive you can test this week to raise it by 10%?
Final Reflection: Numbers Don’t Lie — But They Must Speak
The numbers are always there. On your receipts, your reports, your shelves, your accounts. But too many store owners ignore them — or drown in them — without turning them into action.
The truth is, metrics are not just data. They’re stories.
Each number tells you something:
- Revenue says if you’re attracting attention.
- Margin says if you’re keeping what you earn.
- Conversion says if your store creates trust.
- Retention says if people love you enough to return.
- AOV says if you’re making the most of every opportunity.
When you read these stories, you stop guessing.
You stop wasting money.
You stop copying what others do.
And you start doing what your store actually needs.
You make decisions with clarity. You act faster. You learn what to stop — and what to do more of. You finally feel like a business owner in control, not just someone hoping for good days.
Don’t wait to be “big” before you track your numbers.
You become big by understanding them early.
So choose one metric. Start tracking it daily or weekly. Write it on a wall. Talk about it with your team. Celebrate when it improves. Ask why when it doesn’t.
Because retail isn’t just about passion or effort — it’s about knowing what’s working and building from there.
Let your numbers speak.
Then let them lead you — to better decisions, better profits, and the growth you’ve been working so hard for.